We are now 97 races in to the new Tapeta surfaced at Wolverhampton
and although a snap-shot at such an early point may appear premature, being
somewhat disappointed with the results to-date, I thought a cursory trend
analysis might throw up some interesting angles.
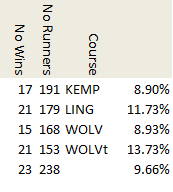
My first port of call was to look at where the winners were
coming from:
There is little to gleam from the results beyond the growing
increase in those horses that are re-appearing on Tapeta (WOLVt) and the obvious
decrease in those that appear last on the old surface (WOLV). The transition
from Lingfield Park to Tapeta looks at this stage more favourable than Kempton
Park. The blank at the bottom of the list signifies those horse that have not
previously raced on an artificial surface.
The statistics regarding the draw are as follow with the
distances displayed as decimal parts of a mile .64 = 5f 20yds, 0.75 = 5f 216yds etc:
Broken down by trip and draw:
At this stage it is hard to make a case for any distinct draw
bias other than to state that the longer the trip, the more any potential bias
is being negated. I would suggest that the two wins from stall 2 over 2 miles
is coincidence rather than framing a bias. If Fridays meeting is a sign of
things to come, we can look forward to a bias free Wolverhampton with stalls 2,
3, 4, 5, 6, 7, 8 and 9 all having a success and further damning of stall 1
which I will be keen to avoid at present. Saturday’s meeting looked decidedly different
with 2, 7, 8, 7, 2, 7, 7, 4 providing the winners.
From a time perspective, it won’t be until we have some 4yo+
times that we can tightened up the standards and get a better comparison, but we
are currently recording time faster than the old standard. This is partly due
to the better quality of races during this time of year and no doubt the larger
and more competitive fields are playing a part.


.png)
.jpg)
No comments:
Post a Comment