THIS WEEKS ALL WEATHER FIXTURES - 26th March KEMPTON PARK- 27th March WOLVERHAMPTON- 29th March WOLVERHAMPTON - 30th March LINGFIELD PARK, KEMPTON PARK & SOUTHWELL - 31st March WOLVERHAMPTON & CHELMSFORD CITY - 1ST aPRIL LINGFIELD PARK & WOLVERHAMPTON - 2nd April KEMPTON PARK -

The Actuary - Horse Racing Tips

I apologise for the delay but as things are quiet presently I have found the time to provide the most requested piece of information '2010 Profit and Loss. Appreciate that the figures are based on returned SP so I hope you do not feel I am stretching your imagination by saying that in all likelihood the profit is greater than that shown.

I am sure that most of you are aware that this is not a good time of the horse racing calendar to be make hay on the All Weather courses. With the infrequency of horse racing fixtures on the All Weather the form lines do become a little tenuous. I still need to keep my database up to date with cards and returns so rather than the information going to waste I continue as normal.

For those new to my blog, I am am hoping this will provide some reassurance in the profitability of my figures backed up with a new 'How to use' page where I will post ideas on applying the figures for greater profit and reducing risk. BUT remember that my whole ethos is based on profit and NOT strike rate. A little patients on your part you will see how they can be at odds with each other. My job is to find that happy medium so as not to frustrate you!

For those among you who do believe Profit and Strike Rate go hand in hand I would like to point out this is seldom the case. The choice of a 50% strike rate of odds on shot or a 20% strike rate giving winners at 10-1+ should be a mathematical equation that you are all comfortable with. The by-product is that we will see long losing runs but I am hoping you are here for long term profit.

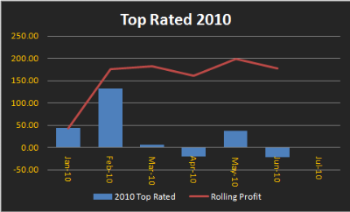
Here (in blue) are the monthly profit and loss by blindly backing the top rated horse in every race. This is not an endorsement to back every top rated horse, it is more to make you aware of your entry point. The intention is to sort the wheat from the chaff to maximise profits from a sound platform. The red line is showing the actual rolling points profit year to date.

The two columns below show the actual figures P+L with the rolling profit in the second column.
Photobucket


The two columns below show the actual figures P+L with the rolling profit in the second column.


With July-10 likely to eat away further in to the current profit of 177.35 points for the year I will be giving you
some ideas in the coming weeks on a new 'How to use' page that will help to eliminate some of the more speculative bets.

No comments:

Post a Comment

Horse Racing Tips: 14-1 or 13-2?


Thursday, July 29, 2010

The Actuary - Horse Racing Tips

I apologise for the delay but as things are quiet presently I have found the time to provide the most requested piece of information '2010 Profit and Loss. Appreciate that the figures are based on returned SP so I hope you do not feel I am stretching your imagination by saying that in all likelihood the profit is greater than that shown.

I am sure that most of you are aware that this is not a good time of the horse racing calendar to be make hay on the All Weather courses. With the infrequency of horse racing fixtures on the All Weather the form lines do become a little tenuous. I still need to keep my database up to date with cards and returns so rather than the information going to waste I continue as normal.

For those new to my blog, I am am hoping this will provide some reassurance in the profitability of my figures backed up with a new 'How to use' page where I will post ideas on applying the figures for greater profit and reducing risk. BUT remember that my whole ethos is based on profit and NOT strike rate. A little patients on your part you will see how they can be at odds with each other. My job is to find that happy medium so as not to frustrate you!

For those among you who do believe Profit and Strike Rate go hand in hand I would like to point out this is seldom the case. The choice of a 50% strike rate of odds on shot or a 20% strike rate giving winners at 10-1+ should be a mathematical equation that you are all comfortable with. The by-product is that we will see long losing runs but I am hoping you are here for long term profit.

Here (in blue) are the monthly profit and loss by blindly backing the top rated horse in every race. This is not an endorsement to back every top rated horse, it is more to make you aware of your entry point. The intention is to sort the wheat from the chaff to maximise profits from a sound platform. The red line is showing the actual rolling points profit year to date.

The two columns below show the actual figures P+L with the rolling profit in the second column.
Photobucket


The two columns below show the actual figures P+L with the rolling profit in the second column.


With July-10 likely to eat away further in to the current profit of 177.35 points for the year I will be giving you
some ideas in the coming weeks on a new 'How to use' page that will help to eliminate some of the more speculative bets.

No comments:

Post a Comment